> ## Documentation Index
> Fetch the complete documentation index at: https://docs.dovetail.com/llms.txt
> Use this file to discover all available pages before exploring further.
# Workspace analytics
 Available on Business and Enterprise plans
Who can view: Workspace admins and contributors (viewers cannot access this page)
# Overview
Workspace Analytics shows how much research content your team creates over time. Use it to understand usage trends across projects, data, highlights, tags, docs, and contacts.
***
# Open Analytics
To view Workspace Analytics:
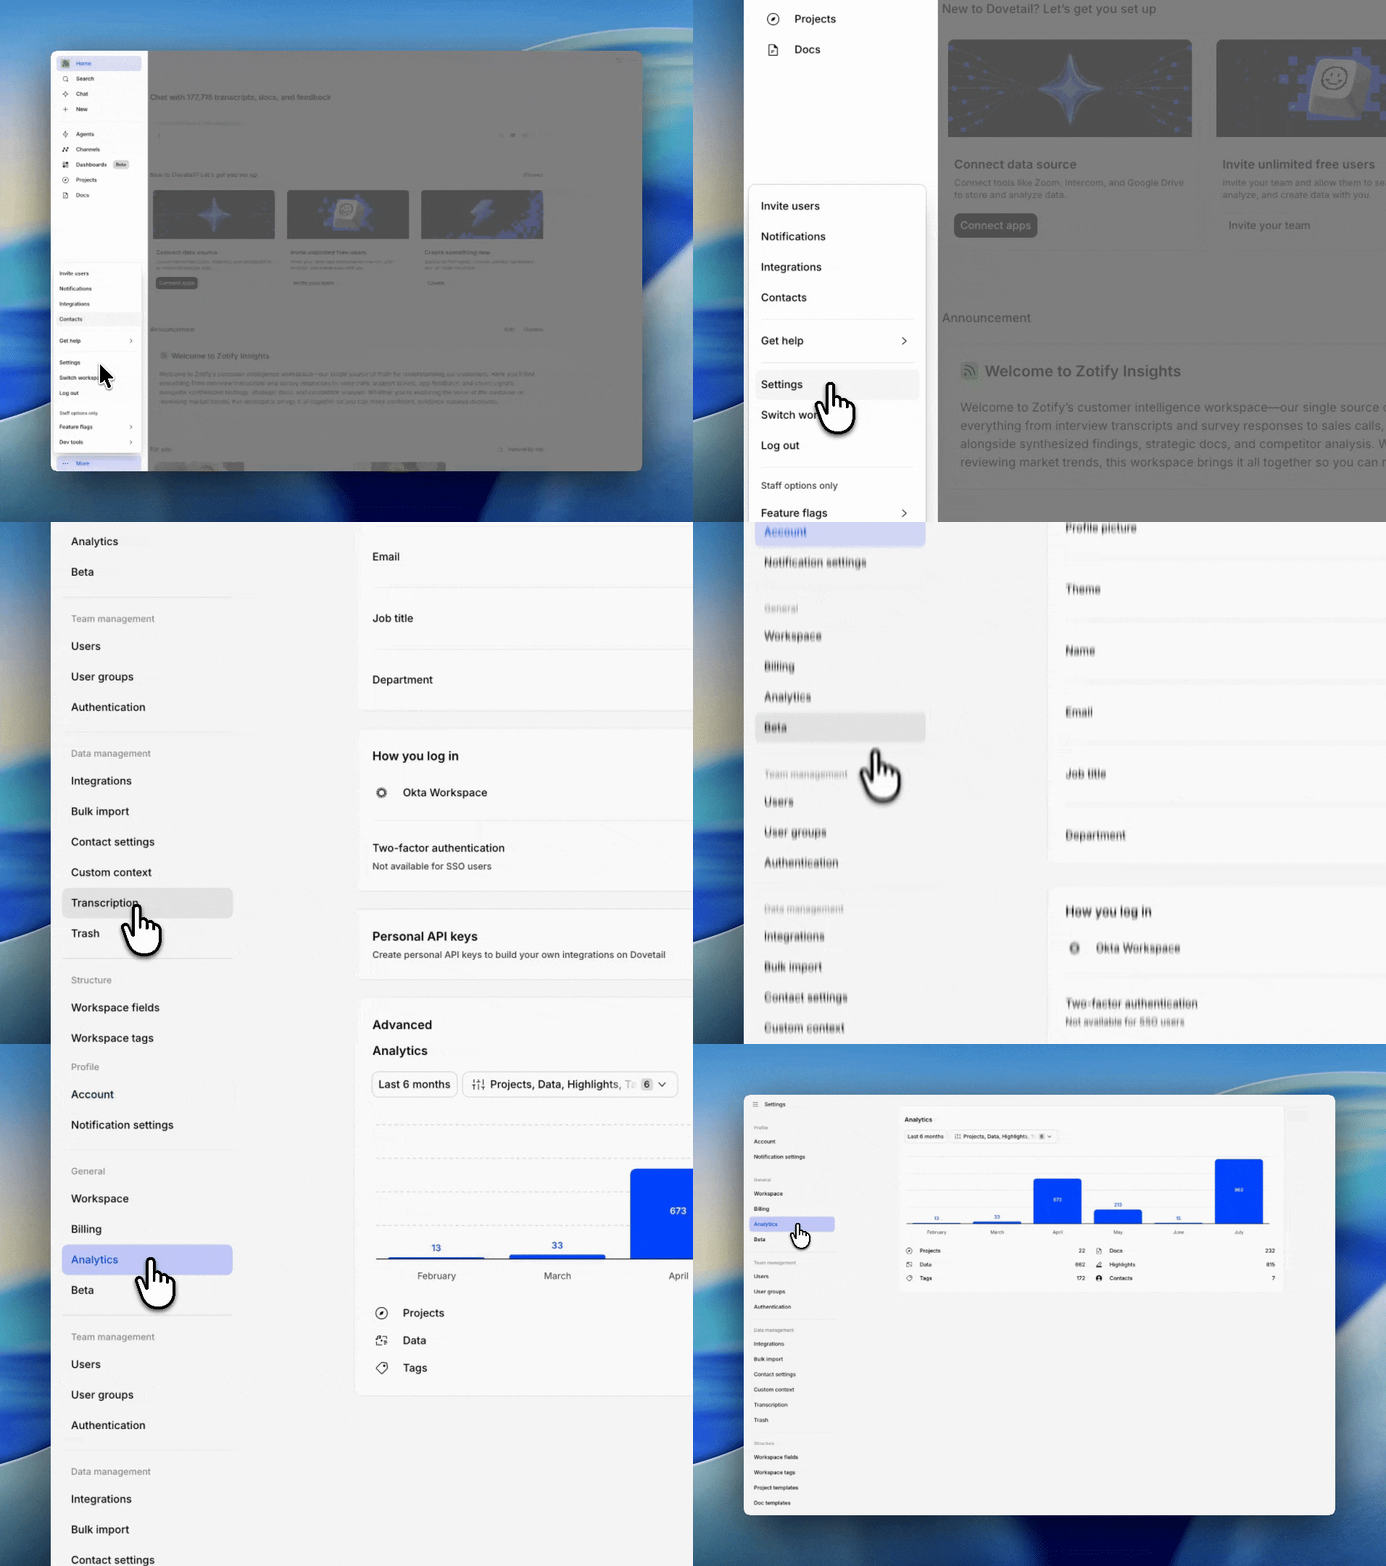
1. Go to [Workspace settings](https://dovetail.com/settings/analytics)
2. Under General, select Analytics
If Analytics isn’t included in your plan, you’ll see an upgrade prompt instead of the dashboard.
Available on Business and Enterprise plans
Who can view: Workspace admins and contributors (viewers cannot access this page)
# Overview
Workspace Analytics shows how much research content your team creates over time. Use it to understand usage trends across projects, data, highlights, tags, docs, and contacts.
***
# Open Analytics
To view Workspace Analytics:
1. Go to [Workspace settings](https://dovetail.com/settings/analytics)
2. Under General, select Analytics
If Analytics isn’t included in your plan, you’ll see an upgrade prompt instead of the dashboard.
 ***
# What you'll see
The Analytics page includes:
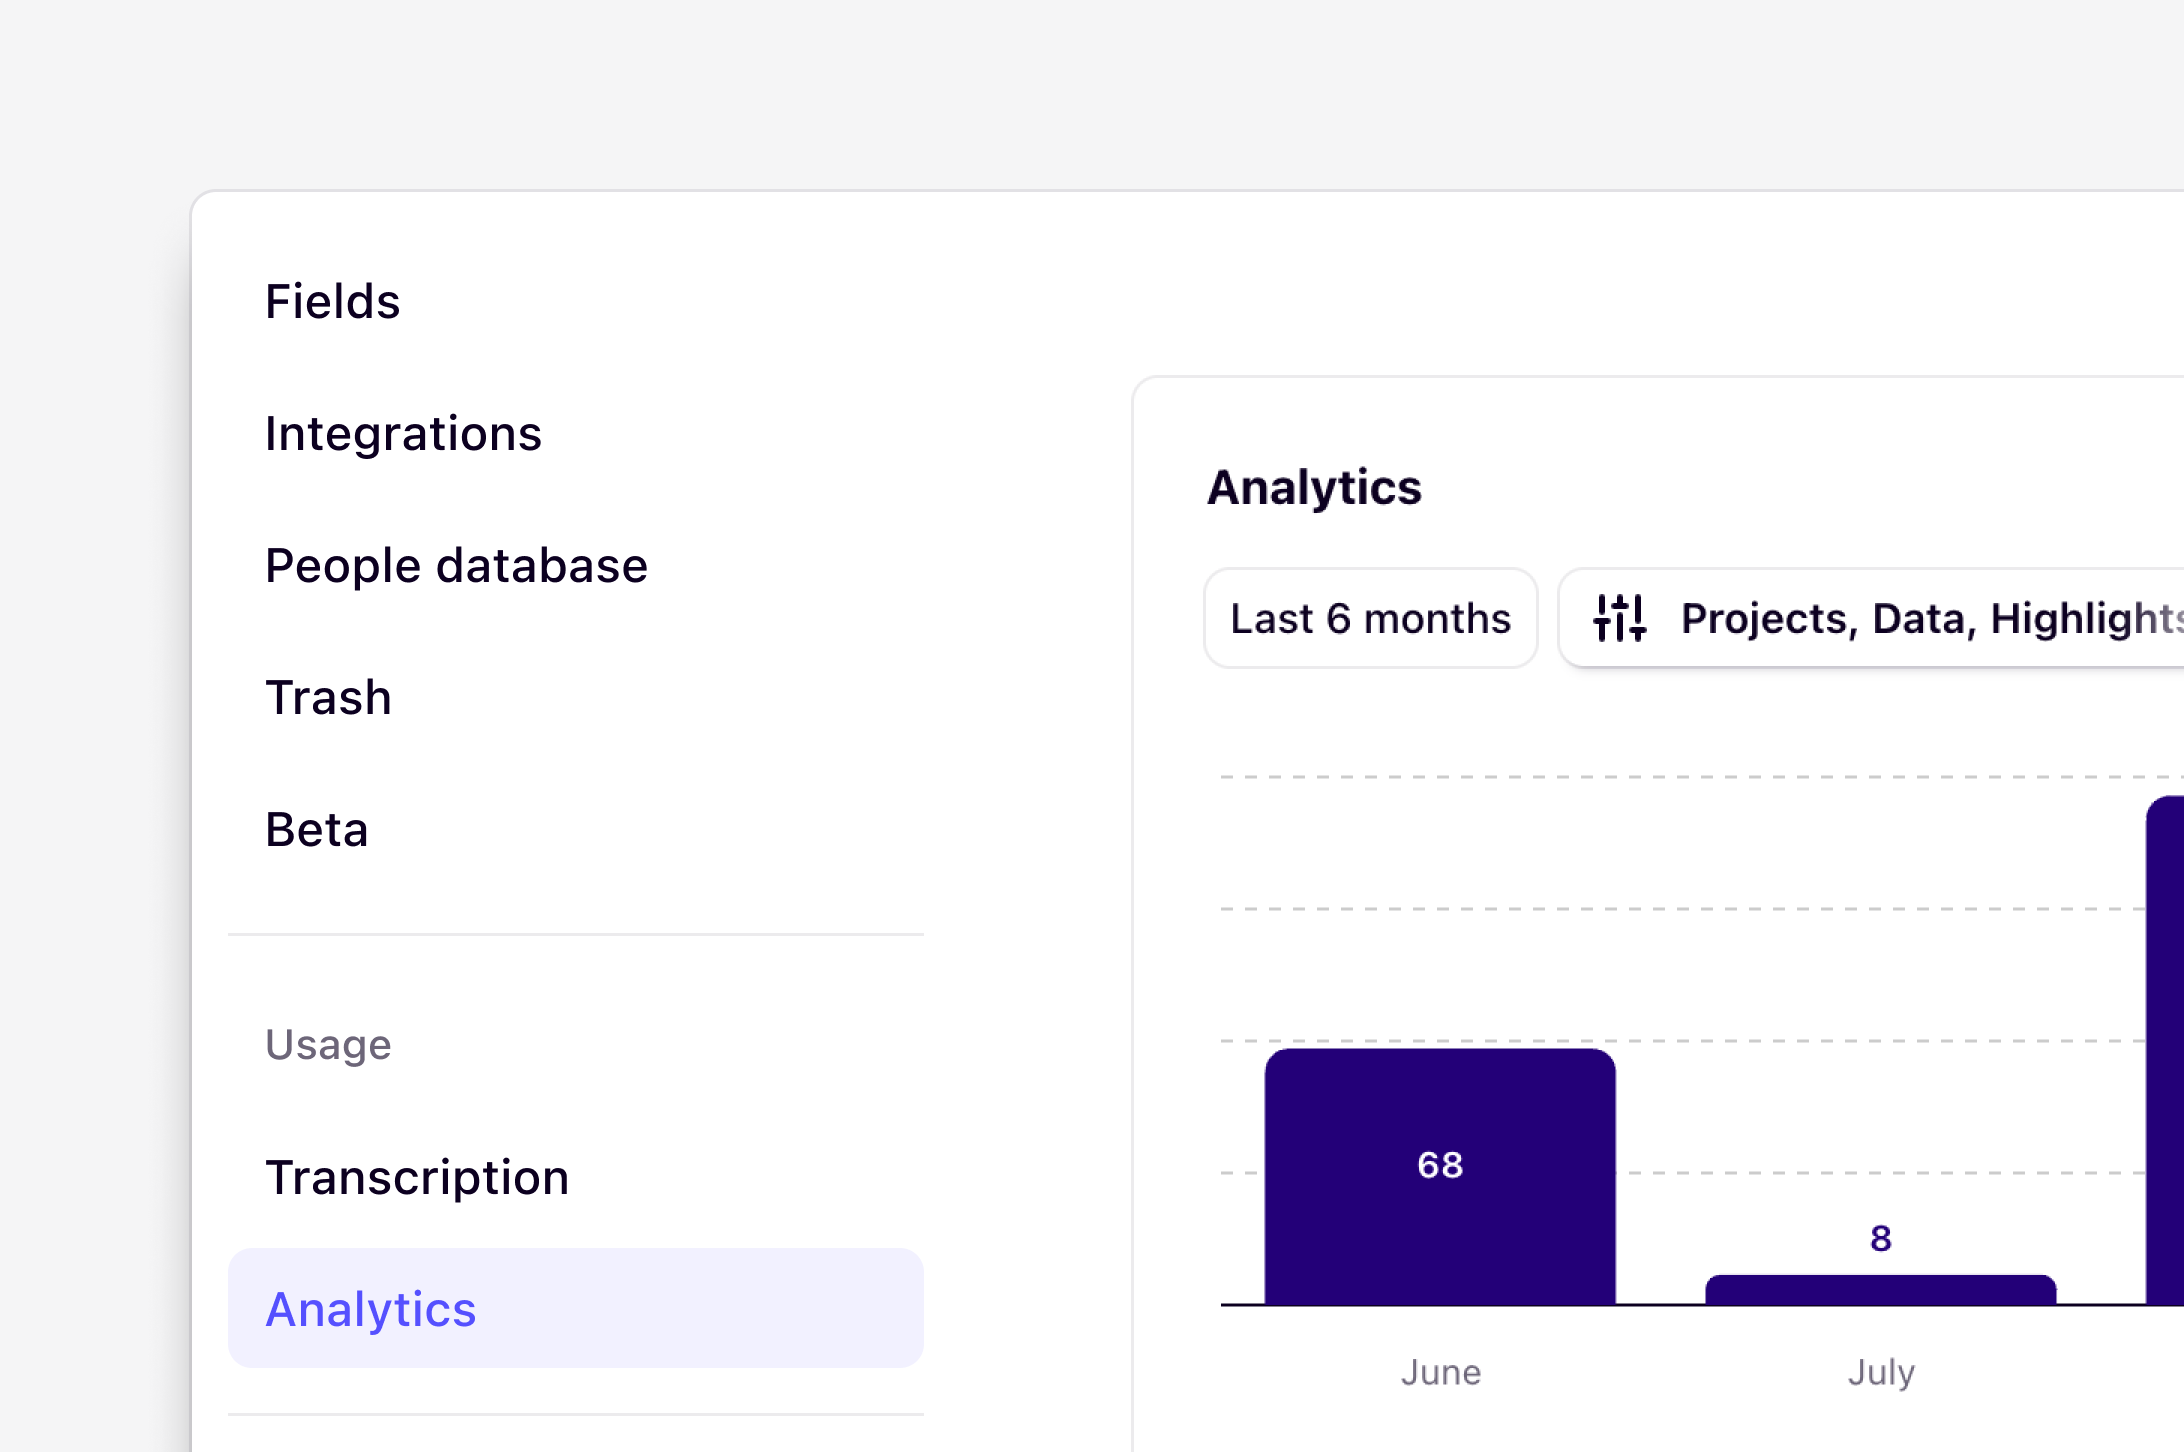
* A date range filter
* An object type filter
* A bar chart of objects created each month
* A totals summary for each object type in the selected range
***
# Choose a date range
Use the date range dropdown to focus on a specific period:
* This month
* Last month
* Last 3 months
* Last 6 months (default)
* Last year
* Custom range
The chart and totals update to match the selected range.
***
# **Filter by object type**
Use the filter next to the date range to choose which object types are included in the chart.
| Object type | What's counted |
| ----------- | ----------------------------------------- |
| Projects | Projects created |
| Data | Data (formerly known as notes) created |
| Highlights | Highlights created |
| Tags | Tags created |
| Docs | Docs (formerly known as insights) created |
| Contacts | Contacts created |
You can turn types on or off individually, or select **Clear** to remove all project-related types from the filter.
When a type is excluded:
* It isn’t included in the chart totals
* Its count in the summary below the chart shows as **––**
***
# Read the chart and totals
* The bar chart shows how many selected objects were created in each month of your date range
* Each bar includes a count label
* The summary below the chart shows the total number created for each object type across the full selected period
This can help you answer questions like:
* Is research activity growing month over month?
* Are people creating more highlights and docs after a research sprint?
* How much new project or contact activity is happening in the workspace?
***
# Tips
* Start with Last 6 months for a quick overview, then narrow the range if you need more detail
* Compare a few object types at a time (for example, Highlights + Docs) to focus on analysis activity
* Totals always reflect the selected date range, not all-time workspace history
***
# Need access?
If you can’t see Analytics in Workspace settings:
* Check that you’re not a viewer
* Confirm your workspace is on a Business or Enterprise plan
* Ask a workspace admin if you need access or a plan upgrade
***
# FAQs
A page view is recorded each time a user loads a unique URL in the product.
***
# What you'll see
The Analytics page includes:
* A date range filter
* An object type filter
* A bar chart of objects created each month
* A totals summary for each object type in the selected range
***
# Choose a date range
Use the date range dropdown to focus on a specific period:
* This month
* Last month
* Last 3 months
* Last 6 months (default)
* Last year
* Custom range
The chart and totals update to match the selected range.
***
# **Filter by object type**
Use the filter next to the date range to choose which object types are included in the chart.
| Object type | What's counted |
| ----------- | ----------------------------------------- |
| Projects | Projects created |
| Data | Data (formerly known as notes) created |
| Highlights | Highlights created |
| Tags | Tags created |
| Docs | Docs (formerly known as insights) created |
| Contacts | Contacts created |
You can turn types on or off individually, or select **Clear** to remove all project-related types from the filter.
When a type is excluded:
* It isn’t included in the chart totals
* Its count in the summary below the chart shows as **––**
***
# Read the chart and totals
* The bar chart shows how many selected objects were created in each month of your date range
* Each bar includes a count label
* The summary below the chart shows the total number created for each object type across the full selected period
This can help you answer questions like:
* Is research activity growing month over month?
* Are people creating more highlights and docs after a research sprint?
* How much new project or contact activity is happening in the workspace?
***
# Tips
* Start with Last 6 months for a quick overview, then narrow the range if you need more detail
* Compare a few object types at a time (for example, Highlights + Docs) to focus on analysis activity
* Totals always reflect the selected date range, not all-time workspace history
***
# Need access?
If you can’t see Analytics in Workspace settings:
* Check that you’re not a viewer
* Confirm your workspace is on a Business or Enterprise plan
* Ask a workspace admin if you need access or a plan upgrade
***
# FAQs
A page view is recorded each time a user loads a unique URL in the product.