Documentation Index
Fetch the complete documentation index at: https://docs.dovetail.com/llms.txt
Use this file to discover all available pages before exploring further.
Available on Legacy, Professional, and Enterprise plansManagers and Contributors with edit access can edit and rearrange data on a canvas, while users with viewer access can only view
Overview
In Projects, the Canvas view gives you a fast and flexible workspace to explore your data and uncover themes. Once your interviews or other materials are broken into highlights, you can visually cluster related pieces to form insights. Collaboration happens in real time, with live updates and visible cursors that show where others are working on the canvas.Add data to your canvas
You can find and select the data you want to work with on your canvas. You can add up to 3,000 objects per canvas.- To do this, navigate to the left toolbar and select
Add. - Use the reference picker to browse existing project data. You can navigate between Not on canvas and All, or use search and filters to find what you need.
- From there, select your data and click
Add to canvas.
Select, duplicate, and move objects on your canvas
- Choose the select tool: Click on the select tool (mouse pointer icon) in the left-hand menu or press
Von your keyboard. - Select single or multiple objects: You can select single objects by clicking on them. To select multiple objects simultaneously, click on the canvas background and drag your mouse over the objects you want to select, or hold
Shiftand click on the objects you’d like to select. You can also drag objects onto Canvas. - Move objects: Once you have selected the objects you want to move, click and drag to move them.
- Duplicate objects: You can copy and paste objects on your canvas by using keyboard shortcuts
⌘CorCtrlCto copy, and⌘VorCtrlVto paste.
Navigate around your canvas
Canvas now uses full-width and full-height layout, giving you more space to work.Move around the canvas
- Using the pan tool: Click the hand icon, then drag.
- Keyboard shortcut: Hold down the
spacebarand click and drag on your canvas. - Using a trackpad: Scroll with two fingers.
Zoom in and out
- Zoom menu: In the top right of your canvas, press the
+and-buttons to zoom in and out, or press the current zoom level to select from predefined increments. - Keyboard shortcuts: Use the
+and-keys on your keyboard to zoom in and out. - Mouse controls: Use the scroll or touch scroll on your mouse to zoom in and out.
- Trackpad controls: Pinch your fingers together to zoom out and move away from one another to zoom in.
Note: For performance, text is not rendered when zoomed out beyond 25%.
Search for data
- Using the search tool: Click on the search icon in the top right and enter keywords to locate objects.
- Keyboard shortcut: Press
⌘Fon Mac orCtrlFon Windows to quickly open the search bar.
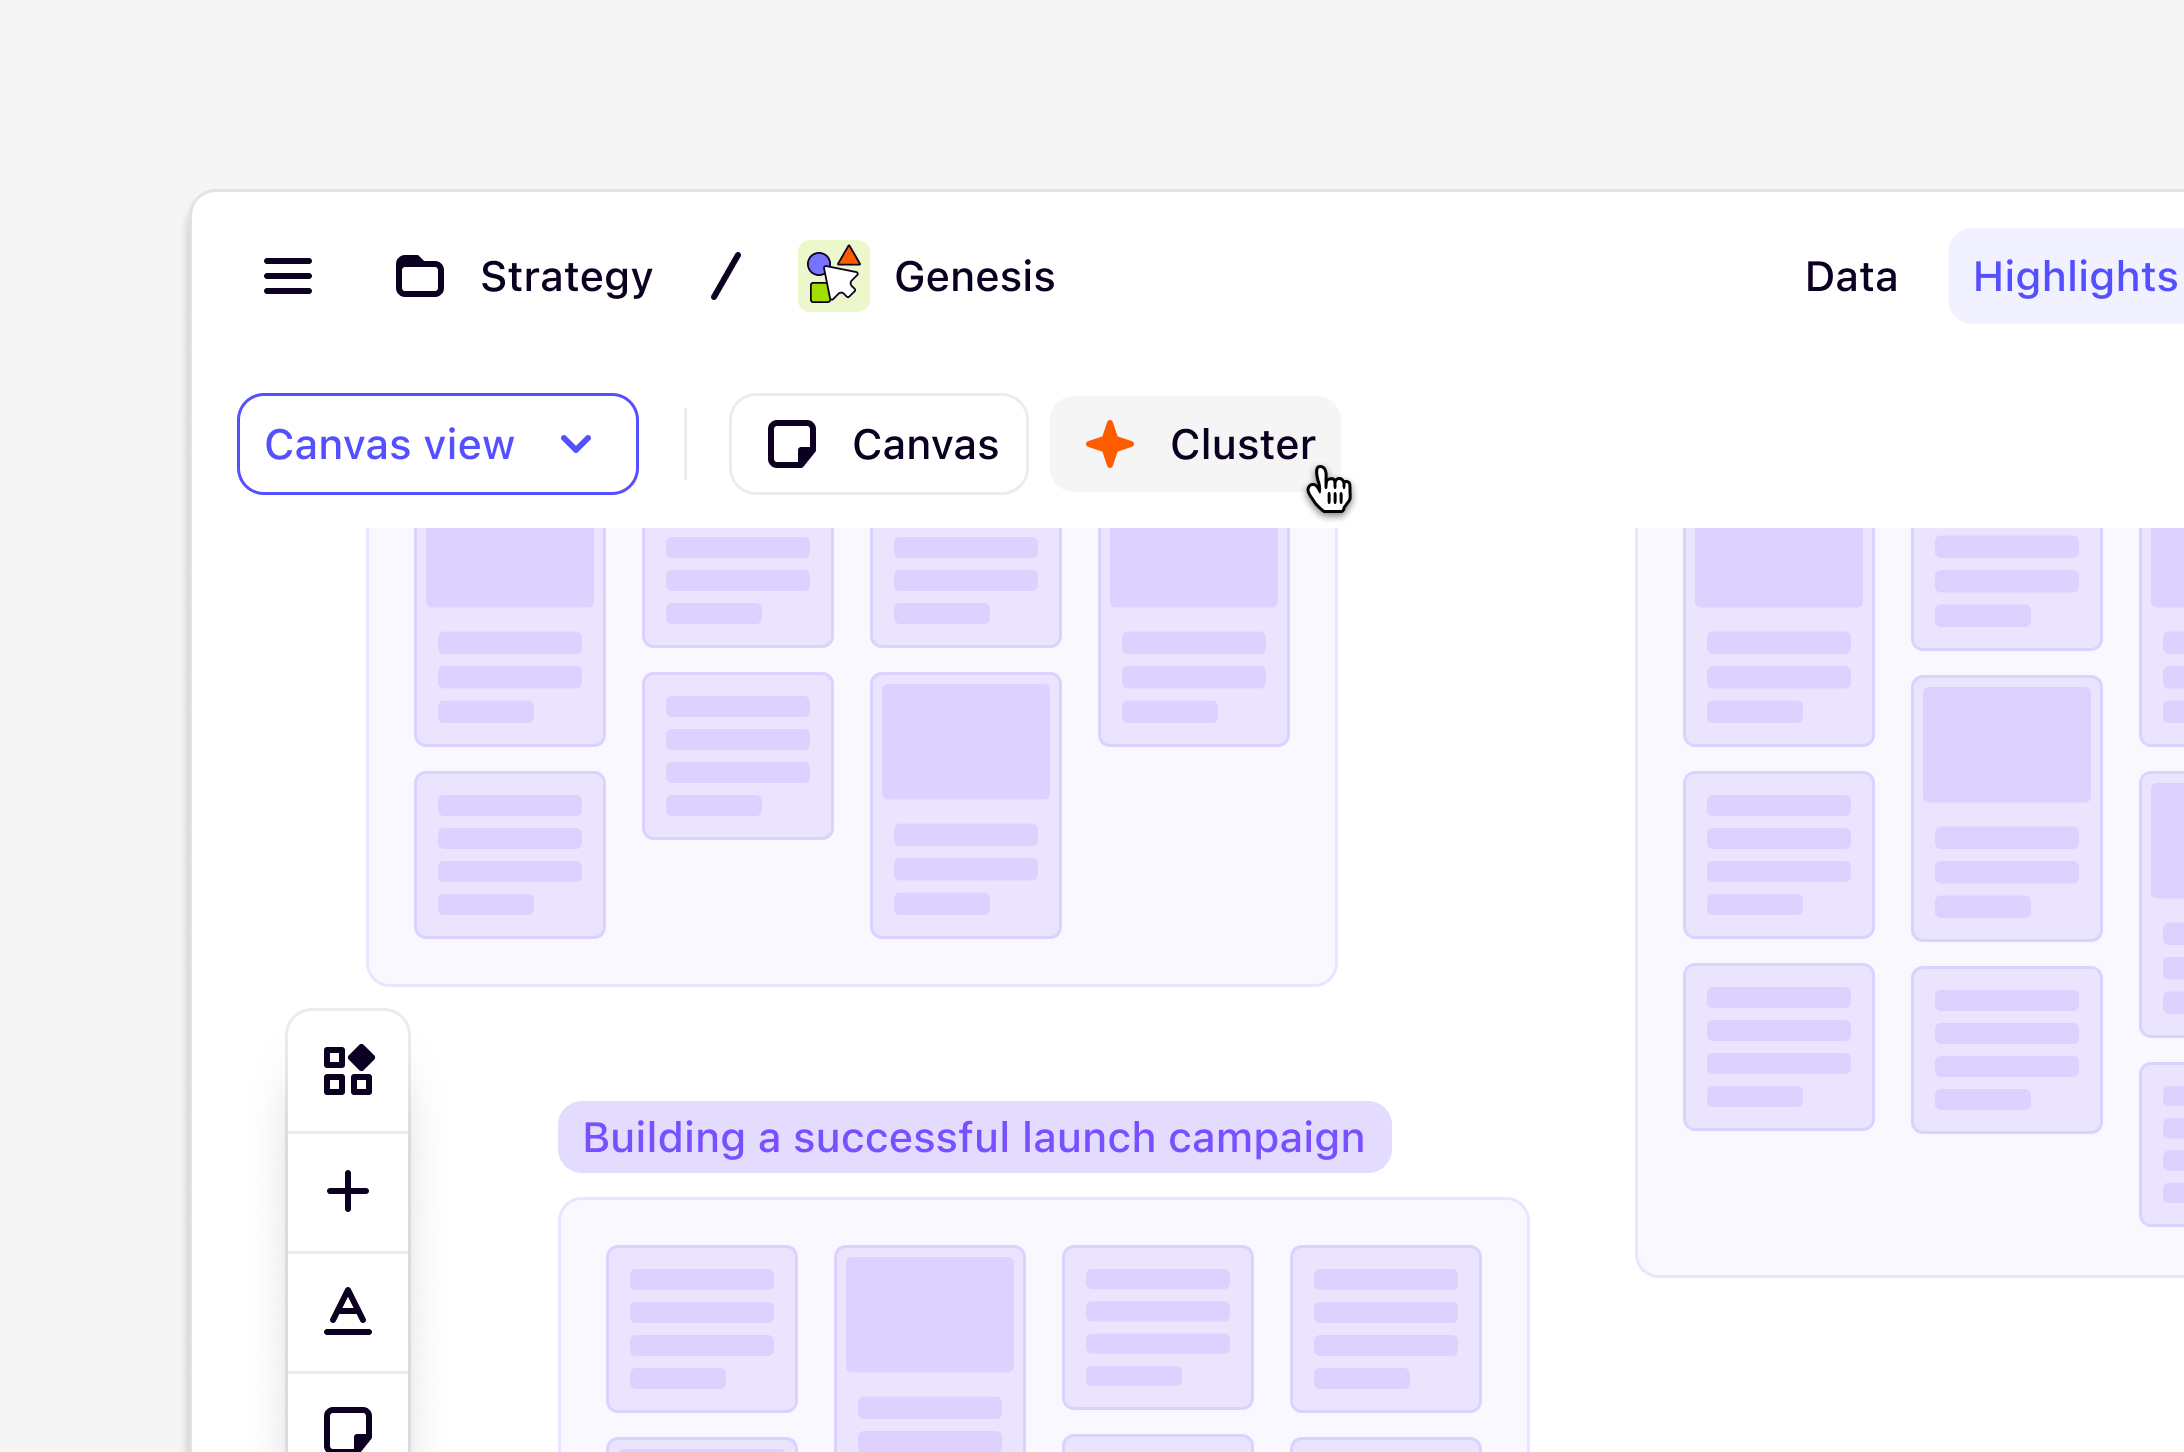
Group related highlights with Magic cluster
Once you have your desired data on your canvas, you can quickly group highlights based on thematic similarities with Magic cluster. Clustering is based solely on the content of the highlights, not any tags or note titles. To do this:- Select your objects
- You’ll see a second toolbar appear at the bottom of your screen
- Click on the blue Magic shuriken icon
- Select how you want to cluster: Themes, Tag, or Data
From there, your highlights will be placed into groups with automatically generated labels. You can also refine these groups further by selecting groups of data and clicking on the Magic shuriken icon again.
Cross-project synthesis
Canvas views support cross-project synthesis, letting you insert references from multiple projects to synthesize findings in one place. This makes it easier to compare findings, connect related evidence, and synthesize insights across sources. To try it out, create a canvas view in a project (or open an existing one), click Add references in the toolbar, or press P to search through references. By default, results are filtered to the current project — remove the filter to see results from all projects.Organize your canvas with new tools
Tidy up
Quickly neaten your canvas by snapping selected objects into a clean, ordered layout.- Select your objects.
- In the bottom toolbar, click Tidy up.
Shapes: circle, line, rectangle
All shapes can be inserted by clicking or dragging from the toolbar onto the canvas.Focus mode
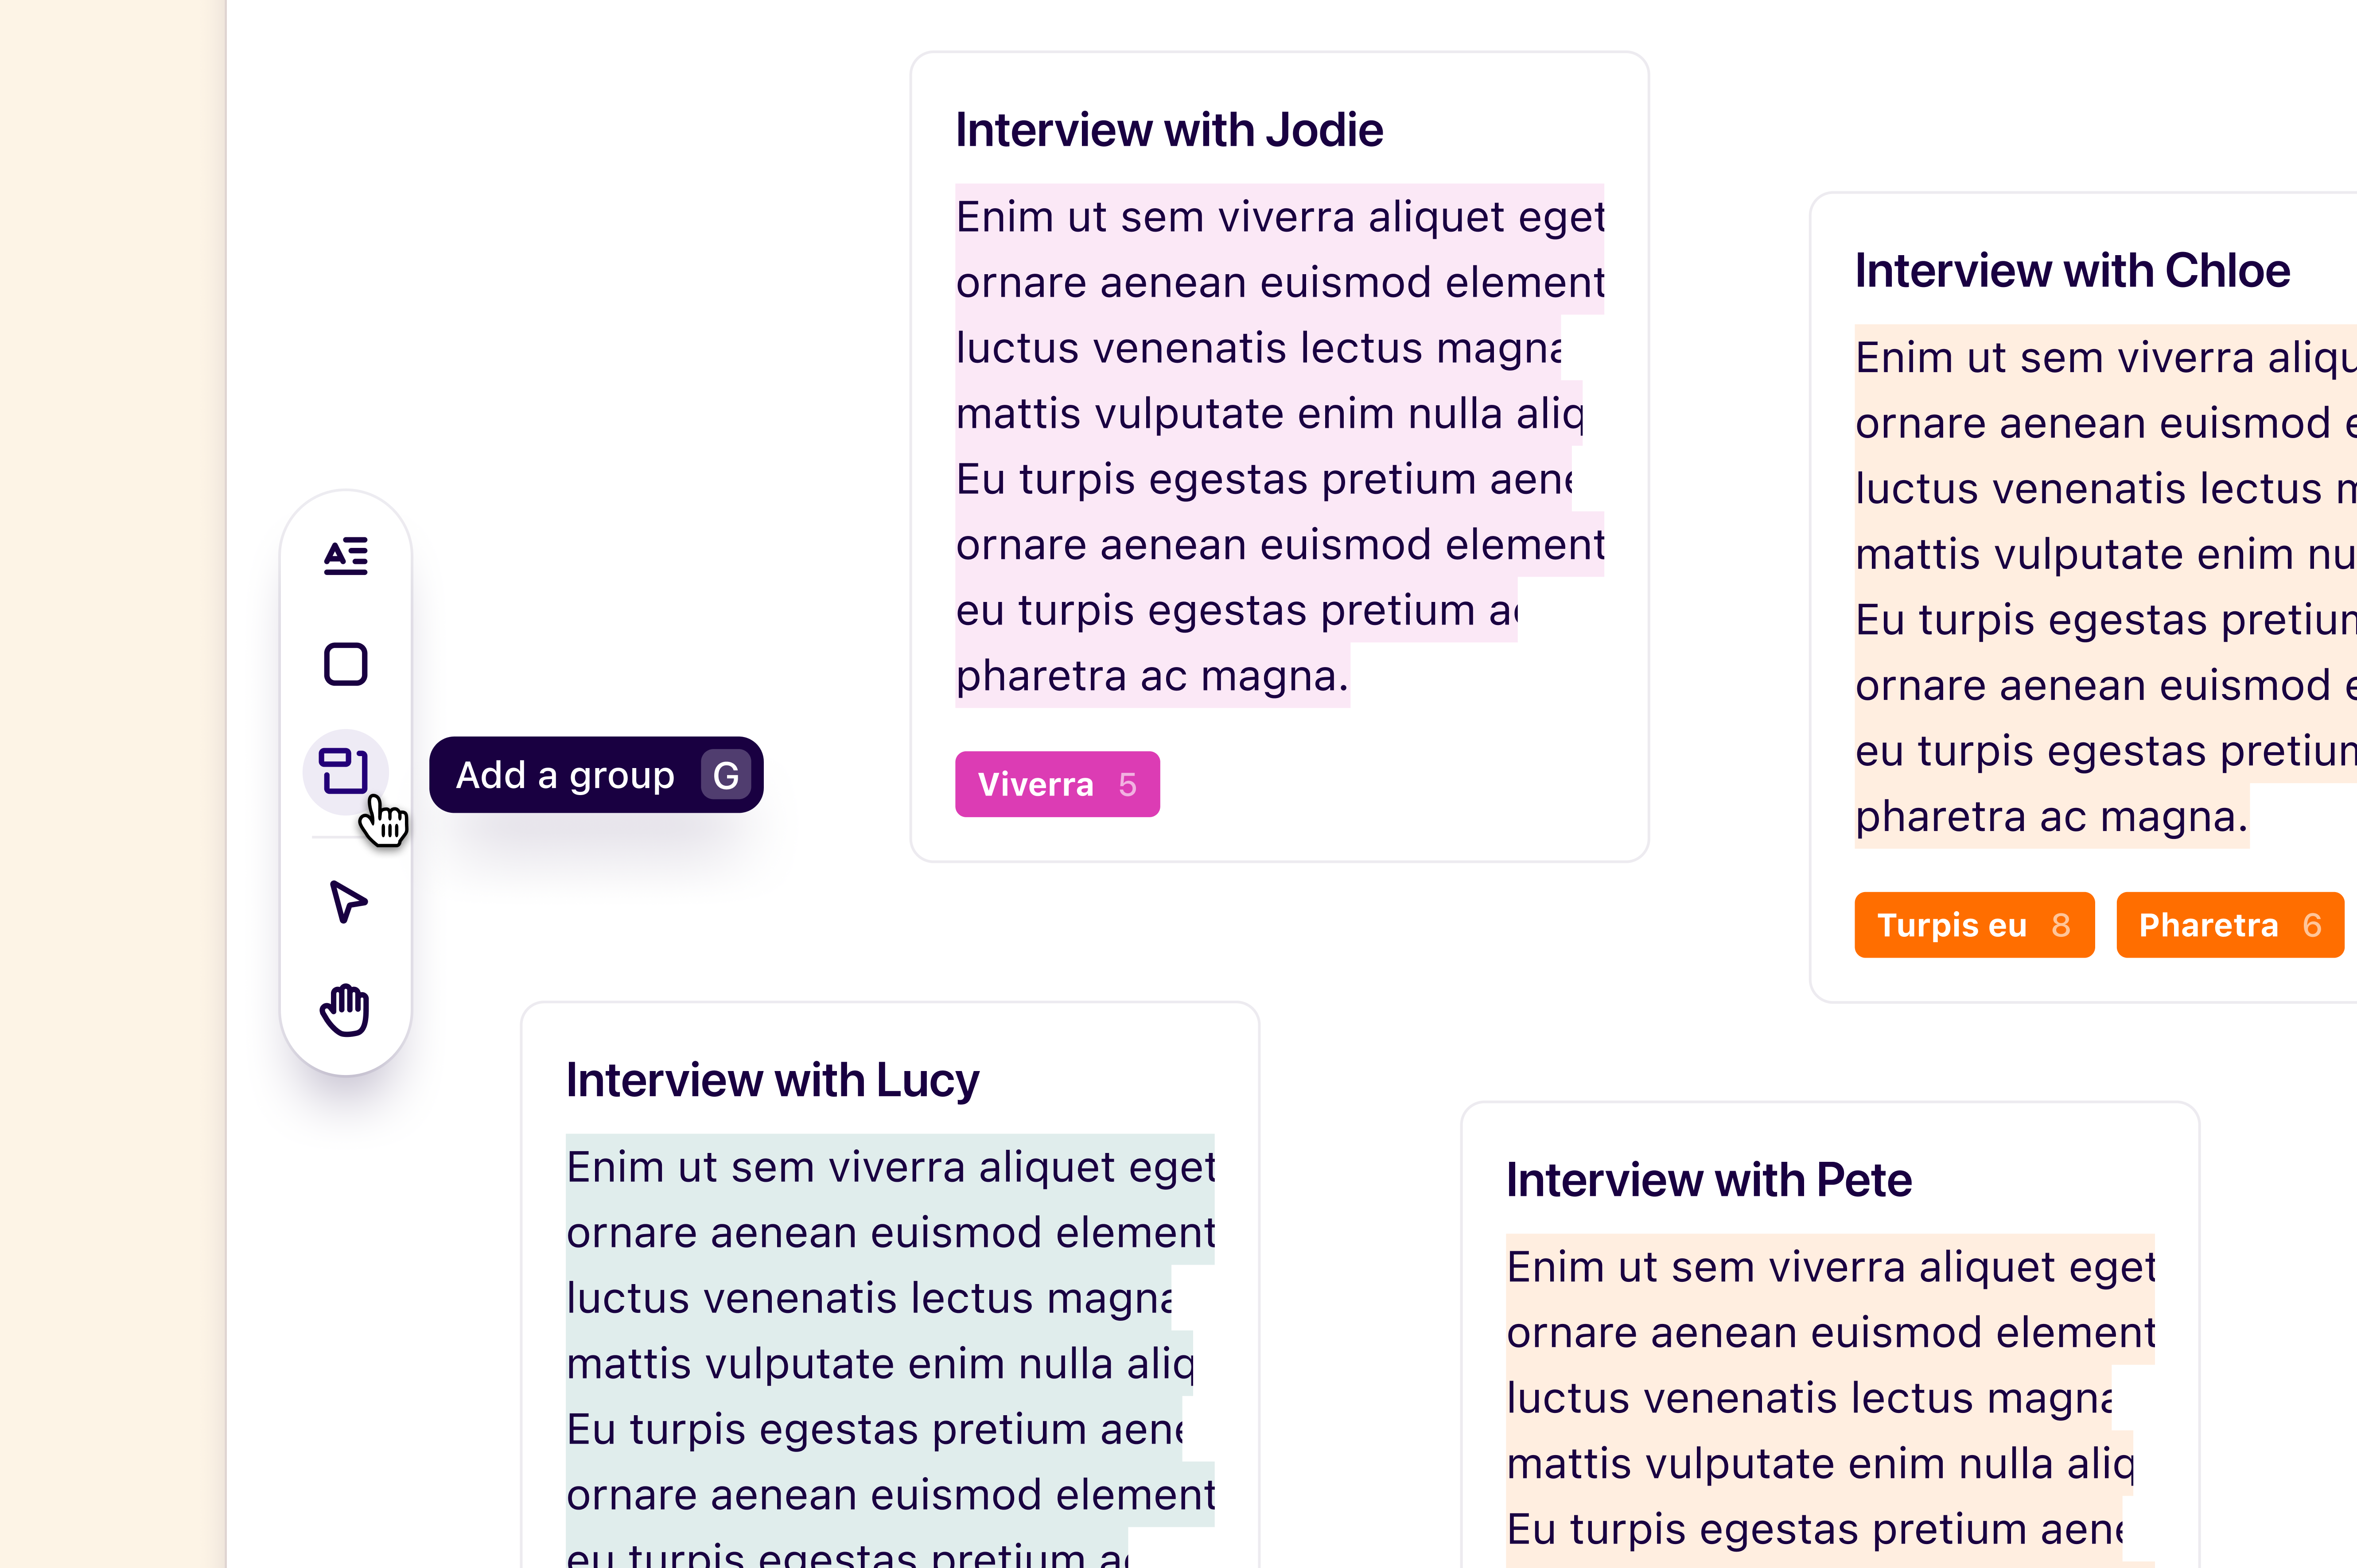
Hide all toolbars and headers to reduce distractions. Using the **⌘ +. **keyboard shortcut hides all toolbars and headers.Define groups on your canvas
You can also manually create groups to combine related content on your canvas.- To do this, select objects on the canvas, press
Add a groupfrom the action menu and enter a title for the group.
- To add new objects to a group, drag objects into it, resizing the group if necessary, or place the group itself over objects on the canvas.
backspace/delete on your keyboard. This will also remove the objects within the group.
Add text to your canvas
You can add additional text to your canvas by adding text boxes.- To do this, select the
Add textbutton in the left-hand menu and click on the canvas to place the text box. - With this, you can change the text size in the text menu and use the keyboard shortcut
Tto create new text boxes.
Add images to your canvas
You can also add images to your canvas, making it easier to present findings with visual context. To do this:- Copy and paste an image directly onto the Canvas
- Select the
Add and imagebutton from the left-hand menu to upload a file from your computer
Work with sticky notes
Sticky notes now show the initials of the creator or last editor, and new notes remember your most recently used color. To add a sticky note to your canvas, click on “Add sticky note” from the left toolbar or typeS on your keyboard
Create and add objects to an insight
When you’ve mapped data into groups, you may want to create an insight or add content to an existing insight to share with your team in a report.- To do this, select objects and press
Add to insightfrom the action menu. - From there, you can search for an existing insight or create a new one to add your objects to.
- To view the insight, you can open this from the pop-up message in the bottom right corner of the screen and customize how your content is displayed.
Create a highlight reel from your canvas
You can also create and download reels directly from your canvas view.- To do this, select a group or two or more video highlights, navigate to
•••, clickDownloadand selectVideo highlight reel. - From there, enter a title for your highlight reel, toggle on or off whether to include subtitles, and select
Download.
Collaborate with your team on canvas
Actions performed by one user apply to everyone viewing the canvas, so if you cluster, move, or remove objects, everyone will have the same experience. Full visibility cursors mean that you can see where everyone is on the canvas at any given time.Follow the view of others on canvas
See the canvas from your teammate’s point of view and track their movements by clicking on their Avatar in the top right, then follow along while they navigate across the canvas.Export your canvas
Previously, Canvas offered a “Download as PNG” option, but this feature has been removed. You can now capture your canvas manually.- Use ⌘ + . (Mac) to enter Focus mode and hide toolbars and headers.
- Take a screenshot of your canvas using your device’s standard screenshot method.
- Share or save the image as needed.
FAQs
How does cluster work?
How does cluster work?
Cluster lets you get a quick start on your synthesis by clustering highlights or insights.If you have nothing selected, Cluster will automatically arrange all of the content within your canvas. You can also select a portion of content and use Cluster to group only the selected content. Clustering can be undone by clicking undo in the toolbar.
Cluster highlights
- By Tag → Clusters highlights into groups based on the tag or set of tags applied. For example, highlights tagged only with “Pain points” will be grouped together, while highlights tagged with “Pain points” and “Charts” will be in a separate group. At the moment, it’s not possible for highlights to appear more than once in a canvas - this is something we’re considering as a future improvement.
- By Note → Highlights that come from “Note A” will be clustered together in a separate group to “Note B”.
- By AI Themes → Clusters highlights into groups based on thematic similarities. See below for more information.
Cluster insights
- By published status → Groups published insights separately to draft insights.
Cluster by AI themes
Clustering by AI themes works by looking for thematic similarities in your highlights. This is based solely on the content of your highlights, not the tags or titles. After creating clusters, Dovetail will also generate titles for each group.After clustering by AI themes, you can use the ‘Cluster’ button to try again.What languages do you support for clustering with AI?
What languages do you support for clustering with AI?
At this time, thematic clustering works best with English. However, the following languages are supported: Spanish, French, Arabic, German, Italian, Dutch, Russian, Ukrainian, Vietnamese, Japanese, Korean, and Simplified Chinese.We are currently monitoring customer feedback to understand how to improve this feature and the languages we support.
Why are the highlight cards blank?
Why are the highlight cards blank?
The highlight cards will appear blank when zoomed out beyond 25%. The text will not render until zoomed in at least to 25%.
This change was made to improve Canvas performance.
This change was made to improve Canvas performance.
Do Canvas references to other projects transfer when exporting or migrating a project?
Do Canvas references to other projects transfer when exporting or migrating a project?
If a Canvas includes references from other projects, those references will need to be recreated and will not be included when exporting or migrating the project to another workspace.
What happens to cross-project highlights if I delete the original data?
What happens to cross-project highlights if I delete the original data?
If you delete the original data from its source project, any highlights created from it will no longer be playable on the canvas, as the source content will be gone. The highlight card may still appear, but it won’t have any content to play back.
Will cross-project canvas references break if I transfer a project to another workspace?
Will cross-project canvas references break if I transfer a project to another workspace?
Yes. If you move a project between workspaces using the project transfer feature, any canvas references pointing to data in that project will break. Cross-project synthesis relies on the data remaining in its original workspace, so transferring a project will sever those connections.