Documentation Index
Fetch the complete documentation index at: https://docs.dovetail.com/llms.txt
Use this file to discover all available pages before exploring further.
Available on Legacy, Professional, and Enterprise plans
Overview
Combine the power of qualitative highlights with a quantitative visualization of your findings using charts. You can access and view chart data per project within a Charts view to understand the highlights and tags surfaced in your notes.Create a chart for your project
Managers and contributors can create a chart in a project. As you create new highlights and tags in your project, all charts will be updated. Charts do not show historical data.- To create a chart, open your project and toggle on Charts under
+in the top right corner of your project.
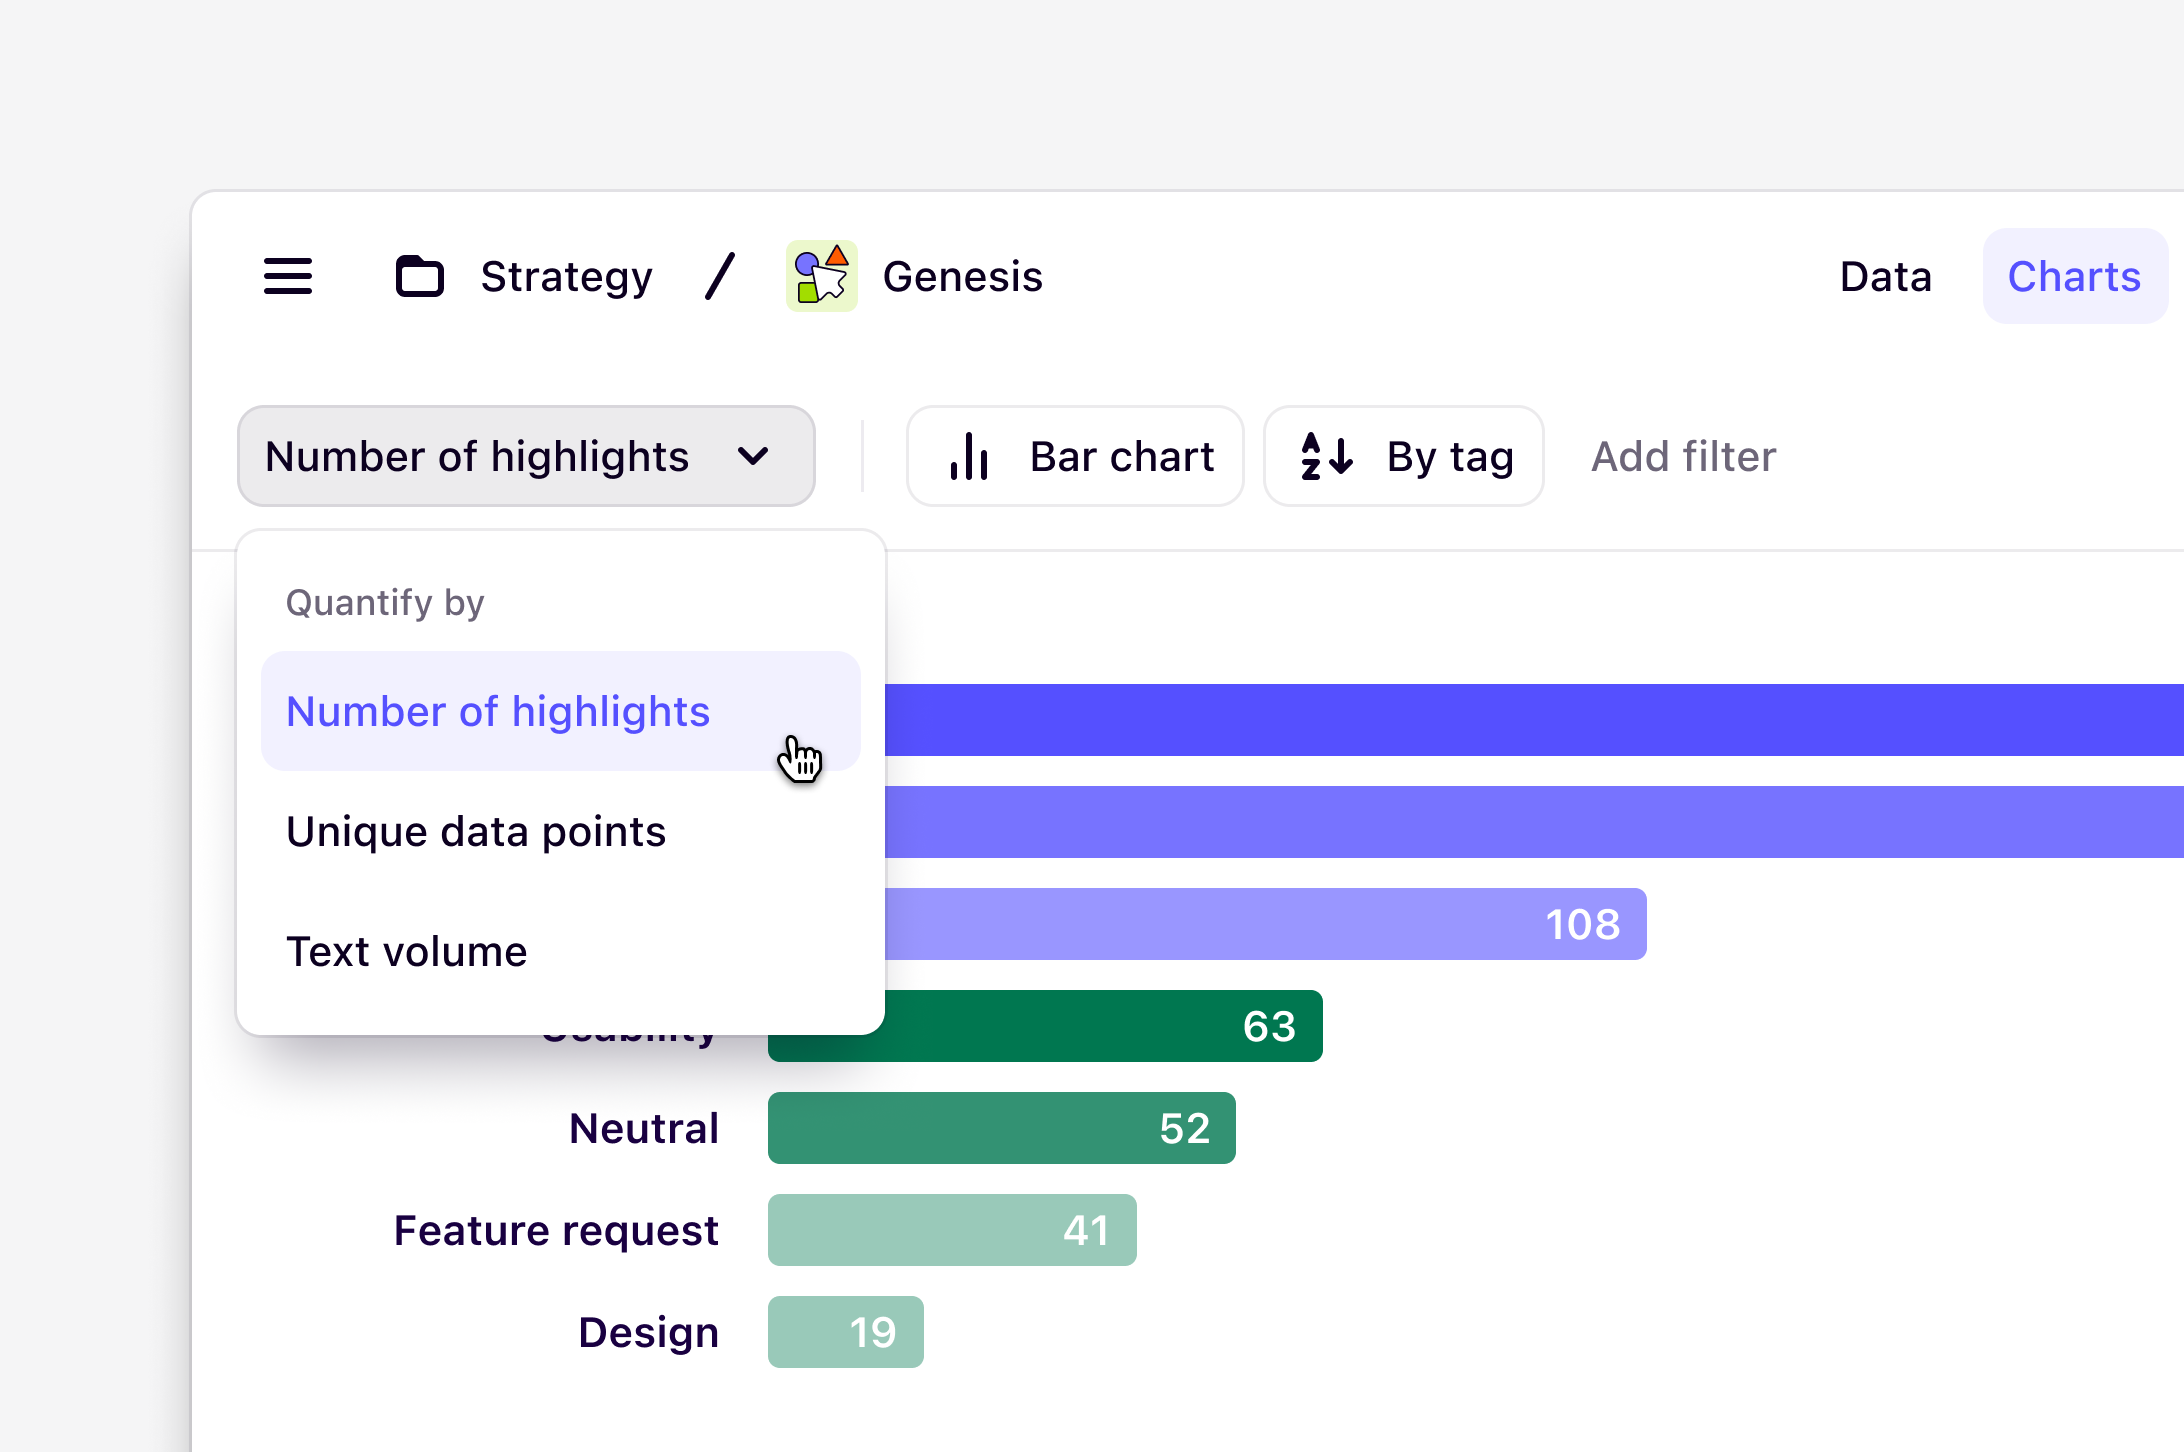
- Number of highlights: This shows the total count of highlights created on notes. For example, if you have 6 notes and added 14 highlights across these, the count would show 14.
- Notes by tag: This is very similar to highlights by tag however it will only count a highlight at most once per note. Using the example above, the count would show 6 rather than 14.
- Word count: This count shows the total character count per highlight. If your data is customer interview transcripts or user feedback, this metric can be useful to help you get an understanding of how much importance the subject places on this topic.
Change chart type
By default, the chart type displayed will be a Bar chart. To change this, select click onVisualize as Bar chart to view options. Chart types include:
- Bar chart - Displays your selected metric as varying horizontal lines.
- Pie chart - Displays your selected metric as a proportionally divided circle.
- Treemap - Displays your selected metric as proportional rectangles.
- Radar plot - Displays your selected metric along a radial axis.
Filter your chart by fields, tags, and text
Slice and dice your chart data by filtering fields or tags to uncover findings from a specific round of research, demographic, and more.- To do this, click
Add filter. You can filter your chart by specific data or insight fields, highlight text content, or tags.- Filter by data fields to explore key themes in segments of your data. For example, round of research, date field, or NPS.
- Filter by a tag to see commonly co-occurring themes in your tags. For example, pain points, leading causes, or loss causes.
- From there, select
Add filterto overlay additional filters and toggle off to remove them.
Hide tag data
To the right of the chart, you’ll find a tag list organized by tag groups. By default, your chart will show relevant data for all tags and have Select all tags checked. You can hide specific tags from your chart data.- To do hide specific groups or individual tags click the Expand icon next to a tag group select or deselect individual groups or tags via the checkbox beside it.
Export a chart image
Once you have configured the chart as you would like you can export it as a.jpeg to add to your presentations or share it with stakeholders by selecting the Download button in the top right corner of the page.