Dashboards are available in beta for Professional, Business and Enterprise workspaces. Admins can enable this feature for their workspace in Settings.
Overview
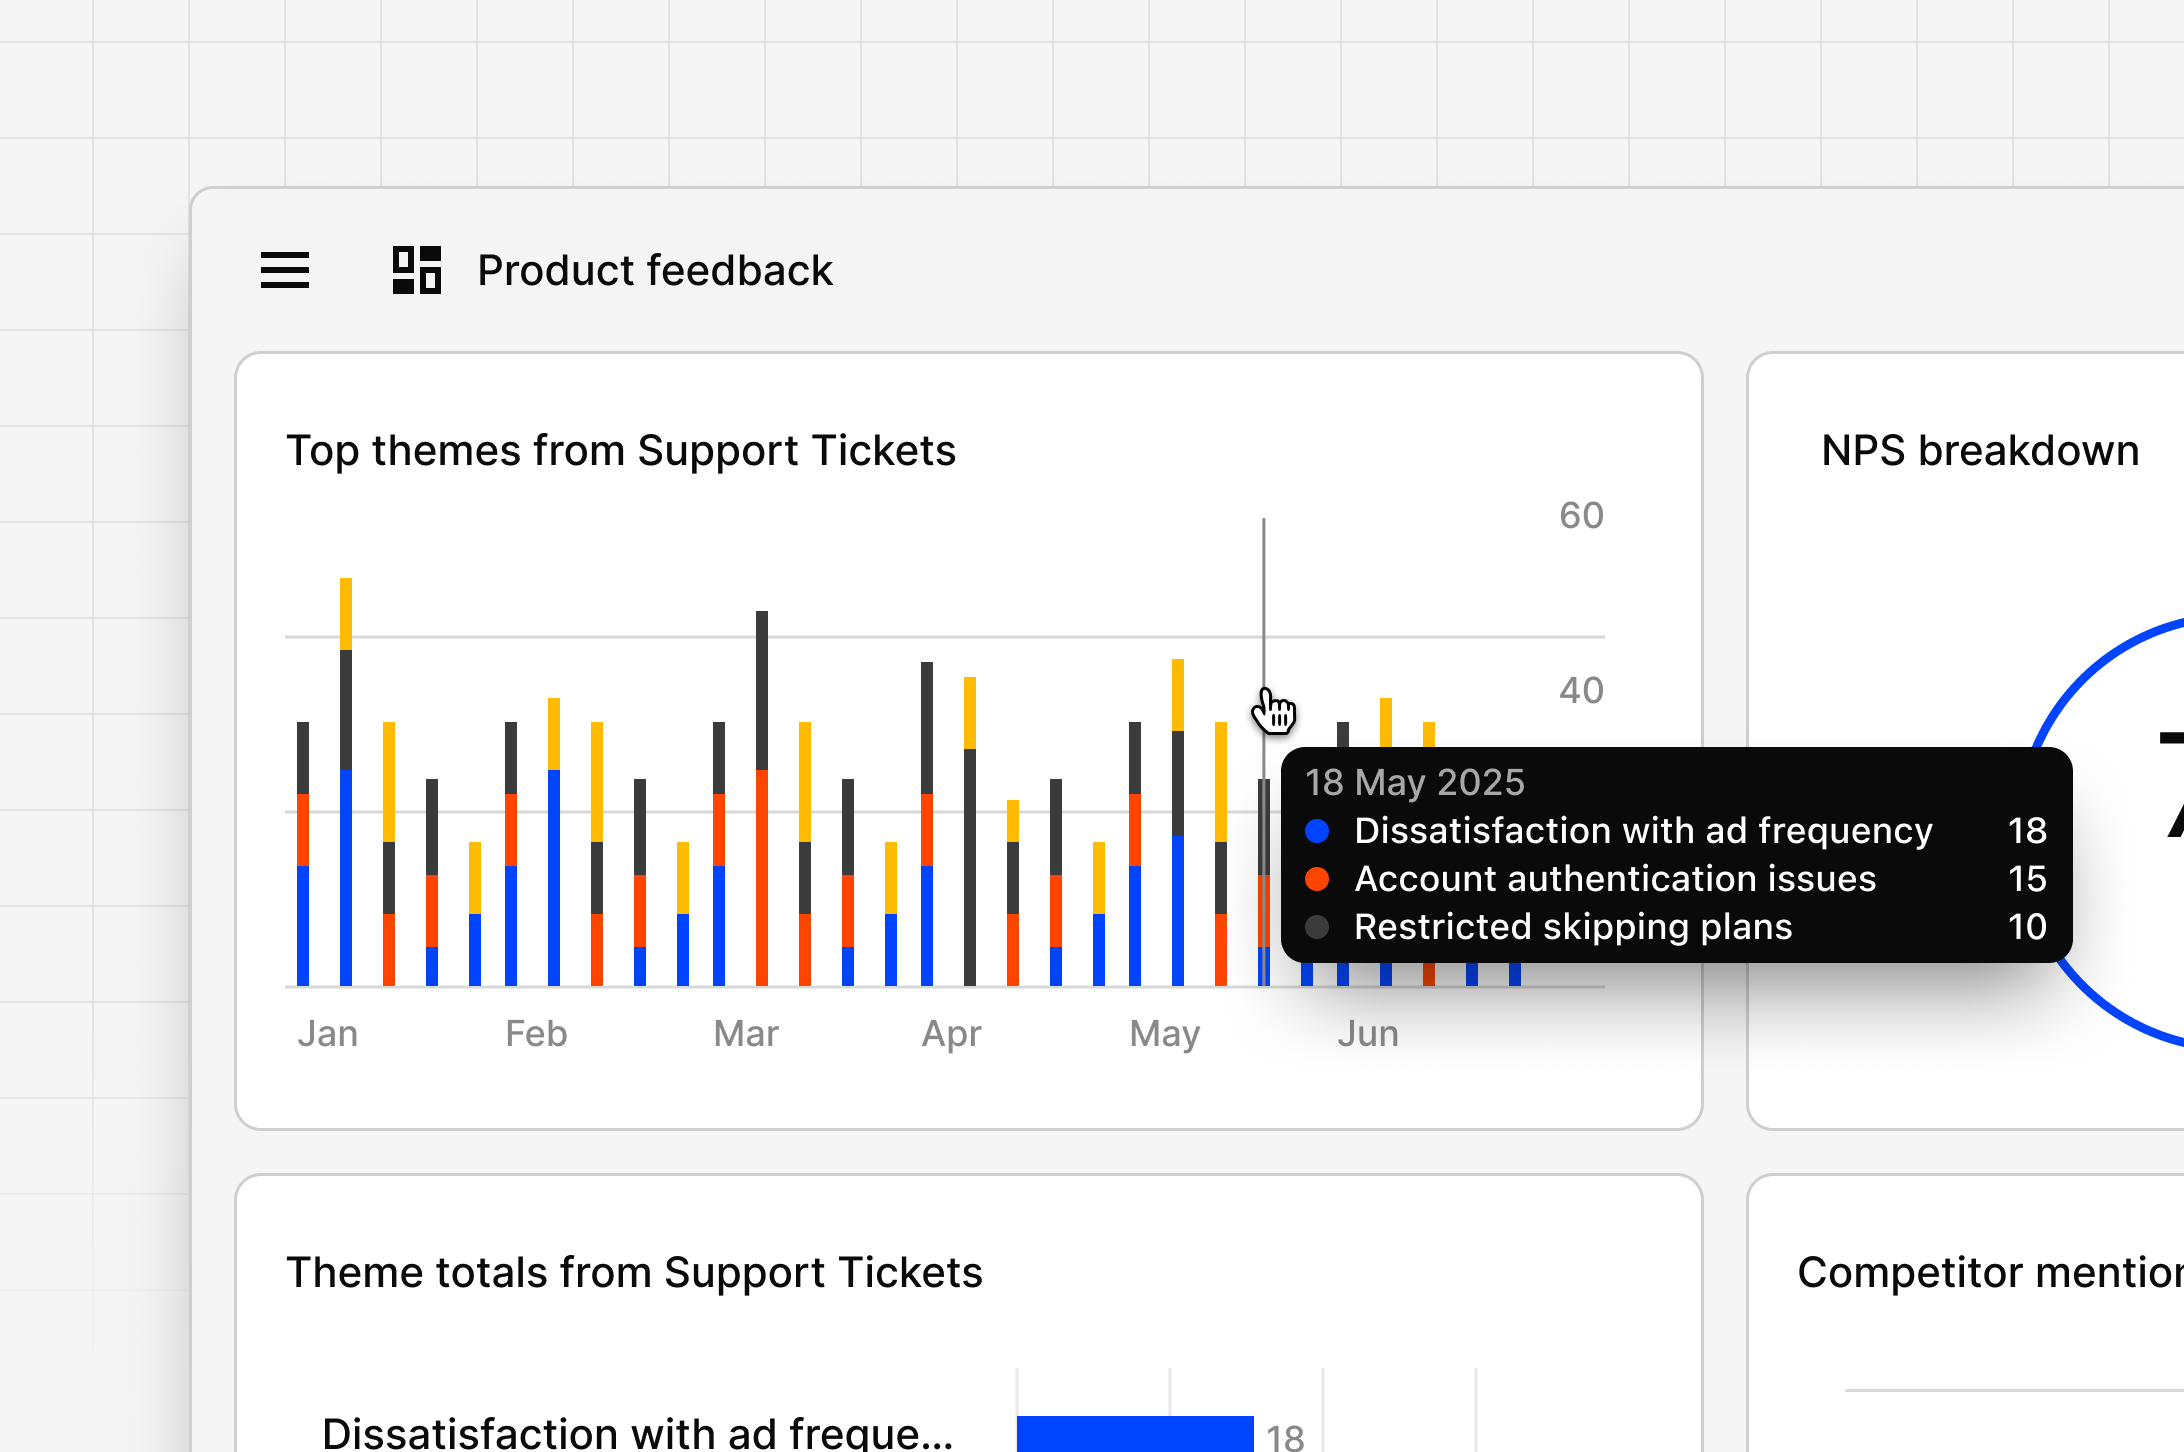
Dashboards let you track feedback and metrics over time. You can combine quantitative data (like CSAT and NPS) with qualitative insights (like themes and sentiment) in one view. They show real-time shifts in scores, sentiment, and themes, helping you spot what’s improving or declining.Create a dashboard
A new Dovetail experience is coming on March 31, 2026. We’re updating the app’s navigation and structure. You may notice changes, as some features appear in new locations.
- To create a dashboard, select + New → Dashboard in the global side menu, or in a folder or project.
- Dovetail automatically analyzes your workspace and will populate widgets based on the type of data you have available.
Data displayed on a dashboard will honor any permission controls enforced on the original source data in your workspace. If a user views a chart and does not have access to the original source data (channel or project), they will not be able to view any of the contents within the chart.
Types of visualizations
Dovetail has built powerful visualizations designed to deliver the greatest impact when visualizing qualitative data. The types of visualizations available to choose from will depend on the metric you’re looking to measure and whether that data is available in your workspace. For example, tracking NPS over time. You must have a Channel that is ingesting your NPS metric.| Widget | Data source | Value |
|---|---|---|
| Keyword search | Platform (Projects and Channels) | Identify emerging trends and shifts in customer vocabulary by tracking keyword frequency over time. |
| NPS | Channels | Measure customer loyalty at a glance with a summary score, and also track relationship health trends over the long term. |
| CSAT | Channels | Assess immediate satisfaction levels with a summary score, and also track service quality consistency over the long term. |
| Themes totals | Channels | Quantify the “noise” level of specific themes by comparing the total volume of data points across up to 4 themes. |
| Theme trends | Channels | Visualize the trajectory of up to 4 specific themes to understand if a topic is gaining or losing momentum. |
| Sentiment | Channels | Monitor the emotional health of your feedback to correlate positive or negative shifts with specific dates or releases. |
Add a widget
You can visualize different metrics in set ways that make sense for that data type. A single dashboard can have an unlimited amount of widgets.- To add a widget to a dashboard, click + in the top right corner.
- Next, select a metric (Sentiment, CSAT, NPS, Theme) and choose the channel
- If selecting the Keywords widget, you do not need to select a source. You are able to refine where the results are sourced from using Filter.
- From there, refine results further by selecting a time frame, interval, and applying filters.
- Once done, click Save in the bottom right.
View source data
Every widget includes links to the underlying data powering it. This lets you trace insights back to the original feedback for full context.- Hover over a widget and select the Drill in icon. Dovetail will open up the Channel that contains the data powering the widget.
Chat with a Dashboard
Chat directly from a dashboard or an individual widget to explore the data behind what you see.- Chat with a dashboard: Opens Chat connected to all datasets powering the widgets in that dashboard. Use this to ask questions about overall trends or patterns. Example: “Why did CSAT drop this month?”
- Chat with a widget: Hover over a widget, and select the Chat icon that appears in the floating toolbar. This opens chat in a focused context, concentrating on the dataset behind that widget. Use this to dig deeper into a specific metric or visualization. Example: “What quotes are users saying that is driving negative senitment about pricing.”
Edit or remove a widget
Edit a widget
- To edit a widget on a dashboard, hover over the widget and select the Edit icon.
- From there, this will open the chart editor where you can make any appropriate changes. Once ready, click Save.
Remove a widget
- To remove a widget from a dashboard, hover over the widget and select the Trash icon.
- Once confirmed and removed, you will not be able to restore this chart to the dashboard.
Delete a dashboard
- To delete an entire dashboard, select the Dashboard from Your Work or Browse page.
- From there, click Move to trash. The dashboard will be available to restore in workspace trash for up to 30 days.
Permissions and sharing
Manage and change permissions by clicking on the Share button on a dashbaord.Share your feedback
Dashboards is currently in beta! Use the Give feedback button to let us know how it’s doing. All feedback is shared with the Dovetail team to help us improve the experience. In addition to speed and performance, we’re working hard on supporting additional widget types like summarize, and powering Dashboards with more Projects data.FAQs
What if my Channel is not showing up as an option under the CSAT widget?
What if my Channel is not showing up as an option under the CSAT widget?
Ensure the associated Channel has CSAT selected as a CSAT
fieldHow is the CSAT percentage calculated in dashboard widgets?
How is the CSAT percentage calculated in dashboard widgets?
The CSAT dashboard widget calculates satisfaction percentage based on responses to 1–5 scale rating fields.What counts as “Satisfied” vs “Unsatisfied”?
- Satisfied: scores of 4 and 5
- Unsatisfied: scores of 1, 2, and 3